Mitigation of Potential Adverse Effects of Transgenic Crop Production for Long-Term Improvement of Soil Health
The on-farm study site is located in Delaware County, Iowa (Figure 1) within Major Land Resource Area 104, Eastern Iowa and Minnesota Till Prairies (USDA, NRCS 2006). The landscape is a gently rolling glaciated plain with long slopes comprised of soils in the Bassett-Olin Variant-Bertram-Lilah association, which were formed in loamy to fine sandy sediments over glacial till. All fields were carpet tiled in fall 2011; grassed waterways and terraces have been installed as conservation measures.
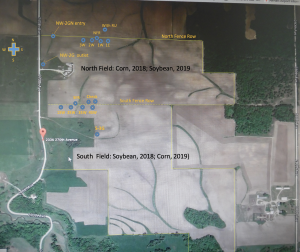
Figure 1. Michael Osweiler Farm, 2336 270thAve, Earlville, Iowa 52041 (Delaware County). Soil sampling sites are shown as blue circles. Note north transect sample sites (3W, 2W, 1W,1E and ‘Check’ 1CW, 2CW, 3CW, 4CE) and south transect sites (1SW, 2SW, 3SW, 4SW); NFR, north fence row; SFR, south fence row; NRU, Corn with Roundup; Grassed waterway soil sampling sites, 2G and 2GN; Drainage outlet sampling site, 3G.
As typical for this region the farm has been managed in a corn-soybean rotation using genetically-modified (GM) varieties with glyphosate herbicide resistance (Roundup Ready) from 1997 to 2015.
After 19 years of continuous GM cropping with annual applications of glyphosate we were concerned about impact on crop productivity due to poor weed management resulting from development of glyphosate-resistant weeds and that residues of glyphosate were affecting soil biology that is critical in promoting crop growth and maintaining soil health and environmental quality.
Thus, many farmers are considering a change toward non-GM cropping systems however, little information is available on time required for dissipation of glyphosate residues or for soil health buildup to guide farmers in assessing the sustainability of management during transition from GM to non-GM crops. We monitored glyphosate soil residues and soil health indicators during transition that began in 2016 to establish baselines to improve soil using ecologically sound soil and crop management to decrease contamination of surface water with glyphosate in runoff and improve soil biology. Transition may improve profitability as premiums are paid for non-GM grains. Decreasing or eliminating use of glyphosate promotes socially responsible benefits by minimizing exposure of the rural community to drifts of glyphosate spray and providing healthy ecosystems through improved soil health.
Objectives for conducting the study: Set up a glyphosate/AMPA monitoring protocol for residues in soils using an intensive soil sampling approach at sites prone to glyphosate drift or runoff and at sites not exposed to glyphosate; Concurrently monitor soil health by measuring selected indicators in crop management transition fields without glyphosate. Crop performance (tissue nutrient contents, N response and leaf chlorophyll, and grain yield) will also be measured and related to soil health status; Develop a guide for farmers to track soil health improvement after transition from GM cropping.
Objective 1a: Monitor glyphosate/AMPA residues in soils.
Glyphosate analyses: Soil samples collected in July 2018 along transects established in non-GM corn and soybean fields, adjacent fence rows and one GM corn field (with glyphosate applications), and waterways were analyzed for glyphosate and amino-phosphonic acid (AMPA) residues. The effective glyphosate (glyphosate x 1.5 + AMPA; HRI Labs) contents were highest for soils cropped to soybean; glyphosate content also varied among samples within crop fields in 2018 ranging from 82 to 227 ng/g soil (ppb) for corn and 318 to 440 ng/g for soybean (Figure 2). Glyphosate was last applied to these fields in 2015 thus showing long-term persistence (3 years+) and a highly variable distribution within small sub-areas of the fields. Some reports suggest that GM-corn may accumulate glyphosate in roots and release into soil, however this does not explain the higher glyphosate content detected in soybean soils as the previous GM corn was planted in 2015. More background investigation will be required to understand the variable glyphosate accumulation noted for corn and soybean.
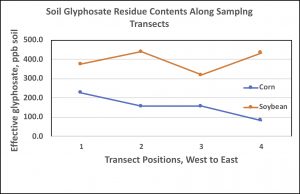
Figure 2. Effective glyphosate residues detected in soils collected along two 400-ft transects established in 2018 corn and soybean fields. Samples collected at 100-ft intervals along each transect and position locations are numbered beginning with western (1) through eastern points (4). The corn transect was 50 ft from an adjacent GM corn field that received Roundup applications in 2018; the soybean transect was adjacent to the non-GM corn field.
Results summarized over the two-year project shows that soil glyphosate residues decreased somewhat in 2019 compared with 2018 (Table 1). Glyphosate continued to be variable across the landscape within short distances with contents reduced from 12 to 58% in soils from transect sites in both fields and by 38% in the glyphosate check (NRU). The NRU site, within a field under continuous GM corn and receiving multiple Roundup applications, showed the highest effective glyphosate contents in soil each year. Decreased glyphosate contents in the grass waterway soils (see Figure 6, Photographs page) ranged from a 24% decrease for the outlet site to 66% at the inlet (see Figure 7, Photographs page) where we suspect glyphosate entered from the adjacent field in runoff and sediment. We suggest that the overall decreases within four years after last Roundup application to the crop fields were due to changes in management during transition away from transgenic crops and termination of any glyphosate applications in the future. Based on the high dissipation in the waterway, establishment of perennial vegetation or rotation to include cover crops during the off season likely supports a diverse and highly functional microbiome capable of relatively fast glyphosate degradation. The variable decreases in residual glyphosate content noted within the fields and across the corn-soybean rotation suggests that the extent of biodegradation is also variable likely due to a variable distribution of functional microbial communities across the field landscape, which may be a result of different soil properties and microclimatic factors. For example, site 2GN (grass waterway inlet at north field fence row) had highest values for soil organic matter (8.9%, Table 2), soil active carbon (890 mg/kg, Table 5), and total microbial biomass (186,890 pg/kg, Table 6), which contribute to high functional microbial diversity, including herbicide biodegradation potential, that likely contributed to the 70% decrease in effective glyphosate content in 2019.
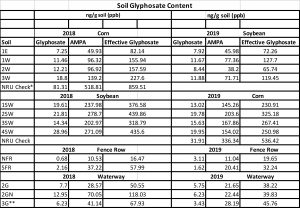
Table 1. Glyphosate and AMPA contents detected in soils during 2018 -2019. *Site NRU from field adjacent to North field that is in continuous GM corn receiving recommended applications and timings for Roundup.**Site 3G is situated near bottom of NE-SE slope in south field with drainage outlet into adjacent pasture. This site is not developed as a grass waterway and is sparsely covered with scattered weed escapes.
Objective 1b: Monitor soil nutrient status
Soil analyses: Soil test properties were determined for each sample site along the transects plus for samples from fence rows, adjacent GM corn field and waterways. Measurements included pH, soil C (soil organic matter), total N, macronutrients and micronutrients. The soil health indicator, active carbon, was analyzed using the permanganate oxidizable C (POXC) assay, an estimate of labile soil C. Most nutrient levels were within sufficient ranges for both corn and soybean crop performance standards except for insufficient levels for boron, copper, and molybdenum in nearly all samples (Table 2). Potassium was rated insufficient for soybean in two of four samples. Evidence for persistence of soil glyphosate contents based on relationships with soil contents of specific nutrients was not consistent. The lower phosphorus (P) contents at soybean sites (highlighted data in Table 1) suggest that glyphosate may be concentrated since it shares same soil adsorption sites as P. Also, lower soil pH in some samples (all soybean and some corn) may contribute less reactive glyphosate as the compound carries less charge under these conditions, may be less adsorbed, occur in soil water, and more available for plant uptake. This may be the case for the corn field receiving 2018 glyphosate applications (‘With RU’) on soil with a pH of 5.06, which likely led to the highest soil glyphosate content, and likely contributed to high glyphosate content at the entrance to the grass waterway (NW-2GN) in the north field via erosion and/or runoff. Higher soil organic carbon (SOC) at some sites may hold (adsorb) glyphosate, accounting for higher glyphosate content relative to samples with lower SOC. Overall, most of the nutrient content in soils were similar suggesting adsorption of glyphosate by cation nutrients as a means of glyphosate retention in soil was likely similar in both fields.
| Soil Analysis – 2018 Osweiler Farm | ||||||||||||
| mg/kg soil or ppm | ||||||||||||
| Sample Site | Soil Gly* | pH | SOM % | SOC % | P | K | Ca | Mg | Fe | Mn | Zn | Cu |
| 3W-2018 Corn | 227.6 | 5.63 | 1.84 | 1.05 | 119.28 | 169.23 | 881 | 191.44 | 82.9 | 20.9 | 5.93 | 0.56 |
| 2W-2018 Corn | 157.6 | 5.79 | 2.54 | 1.45 | 88.25 | 175.67 | 1006 | 218.71 | 69.1 | 22.3 | 5.74 | 0.68 |
| 1W-2018 Corn | 156.0 | 5.77 | 2.66 | 1.52 | 59.34 | 273.35 | 1045 | 243.98 | 60.6 | 22.8 | 5.28 | 0.67 |
| 1E-2018 Corn | 82.1 | 5.85 | 2.68 | 1.53 | 50.30 | 149.20 | 956 | 207.96 | 62.3 | 27.0 | 4.95 | 0.78 |
| NRU–2018 Corn | 859.5 | 5.06 | 2.52 | 1.44 | 40.36 | 191.42 | 793 | 141.5 | 64.3 | 28.9 | 9.09 | 0.68 |
| NFR-North Fence Row | 16.5 | 5.67 | 2.68 | 1.53 | 52.71 | 197.86 | 1111 | 219.9 | 55.2 | 12.5 | 24.62 | 0.50 |
| 1SW-2018 Soybean | 376.6 | 5.21 | 2.35 | 1.34 | 33.74 | 125.23 | 812 | 213.93 | 64.0 | 31.2 | 2.77 | 0.75 |
| 2SW-2018 Soybean | 439.8 | 5.20 | 2.94 | 1.68 | 37.95 | 129.88 | 846 | 242.99 | 63.6 | 21.8 | 4.06 | 0.66 |
| 3SW-2018 Soybean | 318.8 | 5.32 | 3.01 | 1.72 | 42.77 | 222.18 | 1020 | 263.68 | 73.0 | 25.1 | 3.85 | 0.67 |
| 4SW-2018 Soybean | 435.6 | 5.19 | 3.54 | 2.02 | 31.02 | 275.86 | 1004 | 251.35 | 66.3 | 23.4 | 3.68 | 0.71 |
| SFR-South Fence Row | 58.0 | 4.68 | 2.89 | 1.65 | 25.90 | 56.17 | 870 | 165.77 | 61.3 | 20.1 | 7.57 | 0.48 |
| 2GN – NW Grass Waterway – Inlet | 118.0 | 6.52 | 11.22 | 6.41 | 196.08 | 374.96 | 1706 | 527.76 | 78.6 | 13.0 | 39.15 | 1.98 |
| 2G – NW Grass Waterway – Outlet | 50.6 | 6.50 | 5.48 | 3.13 | 113.85 | 369.95 | 1761 | 466.27 | 113.5 | 20.8 | 11.99 | 1.03 |
| 3G – South Field Outlet – no grass | 68.0 | 6.33 | 2.45 | 1.40 | 21.68 | 133.45 | 1002 | 250.55 | 49.4 | 21.2 | 2.74 | 0.59 |
| *Effective Glyphosate Level calculated according to Food and Agriculture Organization (FAO) method where total glyphosate residue is the sum of the weight of glyphosate + 1.5 × the weight of its metabolite AMPA. | ||||||||||||
| 2019 Soil Analyses | PPM | |||||||||||||
| pH | SOC % | SOM % | Totl N % | P | K | Ca | Mg | Cu | Fe | Zn | Mn | B | Mo | |
| 1E – 2019 Soybean | 5.7 | 1.57 | 2.71 | 0.14 | 28.54 | 225.42 | 1139.60 | 262.82 | 0.58 | 31.72 | 4.84 | 8.93 | 0.2 | 0.0 |
| 1W – 2019 Soybean | 5.72 | 1.46 | 2.51 | 0.13 | 34.48 | 240.23 | 807.26 | 169.96 | 0.42 | 24.02 | 5.09 | 5.89 | 0.0 | 0.0 |
| 2W -2019 Soybean | 5.67 | 1.24 | 2.13 | 0.11 | 44.95 | 214.53 | 795.86 | 152.94 | 0.45 | 29.68 | 4.94 | 7.32 | 0.0 | 0.0 |
| 3W – 2019 Soybean | 5.48 | 1.17 | 2.01 | 0.1 | 67.78 | 137.43 | 800.69 | 154.20 | 0.39 | 36.16 | 4.69 | 7.18 | 0.0 | 0.0 |
| 1CW – 2019 Soybean | 5.59 | 1.23 | 2.12 | 0.11 | 6.18 | 58.38 | 947.16 | 171.64 | 0.34 | 19.73 | 3.23 | 7.85 | 0.0 | 0.0 |
| 2CW – 2019 Soybean | 6.03 | 1.41 | 2.43 | 0.12 | 8.09 | 59.78 | 717.79 | 123.95 | 0.21 | 15.96 | 2.12 | 7.21 | 0.0 | 0.0 |
| 3CW – 2019 Soybean | 5.77 | 1.11 | 1.92 | 0.09 | 9.99 | 41.62 | 960.97 | 169.75 | 0.38 | 24.45 | 3.53 | 11.15 | 0.0 | 0.0 |
| 4CE- 2019 Soybean | 5.61 | 1.79 | 3.09 | 0.15 | 26.16 | 102.51 | 839.04 | 207.35 | 0.44 | 31.68 | 2.76 | 20.57 | 0.0 | 0.0 |
| NRU – 2019 Corn | 4.76 | 1.36 | 2.34 | 0.12 | 29.25 | 109.78 | 701.90 | 101.68 | 0.47 | 35.46 | 7.50 | 14.10 | 0.0 | 0.0 |
| 1SW – 2019 Corn | 5.5 | 1.39 | 2.39 | 0.12 | 27.59 | 71.51 | 832.13 | 185.50 | 0.49 | 30.11 | 4.17 | 12.11 | 0.0 | 0.1 |
| 2SW – 2019 Corn | 5.84 | 1.64 | 2.82 | 0.15 | 19.74 | 96.37 | 905.01 | 223.11 | 0.41 | 26.06 | 3.76 | 9.03 | 0.0 | 0.0 |
| 3SW – 2019 Corn | 5.72 | 1.79 | 3.08 | 0.15 | 19.98 | 133.80 | 822.80 | 186.13 | 0.42 | 22.88 | 2.56 | 9.35 | 0.0 | 0.1 |
| 4SW – 2019 Corn | 5.88 | 1.93 | 3.32 | 0.15 | 43.76 | 143.30 | 1077.40 | 222.06 | 0.23 | 34.20 | 11.94 | 7.42 | 0.0 | 0.0 |
| NFR – North Fence Row | 6.59 | 1.64 | 2.83 | 0.15 | 35.20 | 199.17 | 1005.90 | 203.57 | 0.27 | 31.49 | 4.52 | 5.65 | 0.0 | 0.0 |
| SFR – South Fence Row | 5.14 | 1.89 | 3.26 | 0.17 | 8.56 | 39.11 | 1114.70 | 116.18 | 1.17 | 44.10 | 1.50 | 17.56 | 0.0 | 0.0 |
| 2G – NW Grass Waterway – Outlet | 6.47 | 4.04 | 6.96 | 0.33 | 125.80 | 212.02 | 1635.90 | 351.26 | 1.00 | 59.20 | 22.16 | 9.50 | 0.0 | 0.0 |
| 2GN – NW Grass Waterway – Inlet | 6.35 | 5.17 | 8.92 | 0.42 | 22.59 | 115.65 | 1248.40 | 268.49 | 0.40 | 40.06 | 3.54 | 14.19 | 0.0 | 0.0 |
| 3G – South Field Outlet – no grass | 5.28 | 2.63 | 4.53 | 0.2 | 11.89 | 61.17 | 699.14 | 121.43 | 0.16 | 18.16 | 6.16 | 5.76 | 0.0 | 0.0 |
Table 2. Soil analyses for 2018 and 2019 production fields at Osweiler Farm for SARE Project.
For 2019, soil nutrient analyses (Table 2) reveals similar trends as discussed above for 2018 results. In contrast to soils from North and South fields in transition to non-transgenic crops, the glyphosate control (NRU) shows a lower soil pH and reduced contents of Ca and Mg, possibly a consequence of repeated use of Roundup allowing glyphosate to interfere with the cation nutrients as well as a lower soil pH. The insufficient levels of Boron (B) and Molybdenum (Mo) at nearly all sites is of concern as these are critical micronutrients required for a number of important metabolic functions in both plants and microorganisms.The impact of perennial vegetation on soil fertility and health is shown in samples from waterways and fence rows, especially in the considerably higher levels of soil organic matter (SOM) and total N, which likely contributed to lower soil glyphosate levels (Table 2).
Objective 1c: Monitor crop performance of corn-soybean rotations (tissue nutrient contents, leaf chlorophyll)
Plant tissue analyses: Nutrient analyses of leaves during active growth of corn and soybean revealed some insufficient nutrient levels that may have been affected by glyphosate soil residues (Table 3). However, the effect on nutrient level in corn was not consistent across samples likely due to variability in nutrient distribution across the field, even in the localized area of the transect. Nevertheless, low levels of potassium (K), zinc (Zn), and boron (B) might be affected by immobilization in soil by glyphosate thereby making these nutrients less available for uptake through corn roots. Molybdenum (Mo) was insufficient or deficient, however, based on past nutrient analyses records, these soils appear to be deficient in this micronutrient regardless of glyphosate application. The less than sufficient levels of nitrogen (N) in corn is likely a consequence of immobilization of micronutrients (and insufficient Mo) required for N metabolism in corn thereby affecting accumulation within the plant. Interestingly, the corn sampled at the site most distant (4CE ‘Check’) from glyphosate-treated GM-corn showed sufficiency levels for all nutrients tested. Although soil glyphosate was not measured, results suggest that glyphosate drift from adjacent fields (as in the case for corn samples along the north transect) might intensify effects on nutrient uptake and metabolism in corn. Soybean was similarly affected by apparent nutrient immobilization by soil residual glyphosate, with more consistent affects across all samples for magnesium (Mg) and Cu as well as two of four samples for K.
| Leaf- 2018 | PPM | |||||||||||
| Sample Site* | Soil Gly* | % Total N | P | K | Ca | Mg | Fe | Mn | Zn | Cu | Mo | B |
| Corn: | ||||||||||||
| 3W-Corn Ear Leaves, R1 Stage | 227.6 | 1.84 | 2398.9 | 17346 | 3322 | 1918 | 71.27 | 57.09 | 18.53 | 9.54 | 2.32 | 4.61 |
| 2W-Corn Ear Leaves, R1 Stage | 157.6 | 2.20 | 2724.2 | 22110 | 2564 | 1541 | 77.99 | 37.08 | 15.20 | 9.30 | 1.42 | 3.76 |
| 1W-Corn Ear Leaves, R1 Stage | 156.0 | 2.37 | 3052.6 | 24602 | 2825 | 1613 | 101.12 | 42.85 | 15.68 | 11.56 | 0.00 | 4.25 |
| 1E-Corn Ear Leaves, R1 Stage | 82.1 | 2.26 | 3185.7 | 24150 | 3788 | 2131 | 89.18 | 30.66 | 20.43 | 13.35 | 0.51 | 6.31 |
| NRU-Corn Ear Leaves, R1 Stage** | 859.5 | 2.55 | 3126.5 | 17825 | 3473 | 1705 | 83.21 | 39.13 | 26.70 | 13.23 | 0.00 | 6.31 |
| 4CE-Corn Ear Leaves, R1 Stage*** | n.d. | 2.88 | 2900.5 | 21800 | 5000 | 2200 | 102.9 | 120.80 | 25.37 | 13.10 | 0.13 | 7.9 |
| Soybean: | ||||||||||||
| 1SW- Soybean Leaves, R2 Stage | 376.6 | 5.48 | 3185.7 | 19875 | 7595 | 2330 | 97.02 | 108.28 | 29.64 | 7.15 | 0.19 | 23.42 |
| 2SW- Soybean Leaves, R2 Stage | 439.8 | 5.60 | 3144.3 | 18216 | 7680 | 2495 | 102.61 | 138.04 | 30.50 | 8.11 | 0.00 | 21.23 |
| 3SW- Soybean Leaves, R2 Stage | 318.8 | 5.45 | 3102.8 | 19705 | 7159 | 2079 | 91.05 | 67.99 | 24.89 | 6.08 | 0.00 | 20.75 |
| 4SW- Soybean Leaves, R2 Stage | 435.6 | 5.45 | 3082.1 | 17373 | 6528 | 2059 | 104.48 | 81.85 | 28.22 | 6.91 | 0.00 | 30.45 |
| 2019 Leaf | PPM | |||||||||||||||
| Description | % Sulfur | % Nitrogen | P | K | Ca | Mg | Cu | Fe | Zn | Mn | B | Mo | Ni | Si | ||
| 1E – Soybean Leaves, R2 Stage | 0.2933 | 6.46 | 4117.6 | 21977 | 8948.1 | 3638.7 | 11.258 | 118.1 | 38.072 | 69.742 | 34.423 | 3.0085 | 6.298 | 280.65 | ||
| 1W – Soybean Leaves, R2 Stage | 0.2735 | 6.95 | 4496.8 | 23109 | 7535 | 3932.9 | 12.226 | 128.21 | 39.46 | 71.329 | 35.795 | 0.5014 | 2.7453 | 307.14 | ||
| 2W – Soybean Leaves, R2 Stage | 0.2611 | 6.13 | 4353.6 | 20227 | 7453.7 | 3854.3 | 14.527 | 135.35 | 41.68 | 75.525 | 31.886 | 0.5014 | 7.0246 | 312.65 | ||
| 3W – Soybean Leaves, R2 Stage | 0.2854 | 6.34 | 4159.9 | 21909 | 6984.2 | 3860.3 | 13.437 | 132.97 | 47.23 | 88.339 | 25.508 | 0.6017 | 4.2794 | 354.25 | ||
| 1CC – Soybean Leaves, R2 Stage**** | 0.3005 | 6.33 | 4103.9 | 21672 | 8618.6 | 3874.4 | 12.65 | 116.02 | 39.848 | 63.504 | 33.875 | 1.1032 | 9.2855 | 303.57 | ||
| NRU- Corn Ear Leaves, R1 Stage “Glyphosate Check”** | 0.2047 | 3.29 | 3374.3 | 22473 | 3887.2 | 1789.1 | 22.637 | 149.63 | 30.968 | 81.308 | 7.2 | 0.9026 | 5.2483 | 464.58 | ||
| 1SW – Corn Ear Leaves, R1 Stage | 0.2246 | 3.47 | 3263.8 | 18123 | 4379.3 | 3695.1 | 24.393 | 159.45 | 32.411 | 136.19 | 6.0343 | 0.3009 | 5.0868 | 408.26 | ||
| 2SW – Corn Ear Leaves, R1 Stage | 0.214 | 3.02 | 3060.6 | 21250 | 4478.6 | 3294.2 | 16.887 | 119.29 | 34.409 | 87.432 | 6.1715 | 0.702 | 2.6242 | 410.72 | ||
| 3SW – Corn Ear Leaves, R1 Stage | 0.2084 | 3.41 | 3401.5 | 23768 | 4311.5 | 2689.7 | 16.342 | 140.41 | 27.694 | 70.762 | 6.5829 | 0.6017 | 0.9286 | 428.87 | ||
| 4SW – Corn Ear Leaves, R1 Stage | 0.2022 | 3.31 | 3307.5 | 22378 | 4302.5 | 2363.3 | 23.545 | 156.77 | 32.578 | 83.576 | 6.3772 | 1.3037 | 8.2358 | 503.87 | ||
| * Sites 1E, 1W, 2W, 3W in North field soybean rotated from corn; sites 1SW, 2SW, 3SW, 4SW from South field corn rotated from soybean (2018). | ||||||||||||||||
| **Site NRU from field adjacent to North field that is in continuous GM corn receiving recommended applications and timings for Roundup. | ||||||||||||||||
| ***Site 4CE represent corn sample from south transect of north field not exposed to Roundup relative to north transect samples adjacent to NRU (2018) | ||||||||||||||||
| ****Site 1CC soybean in east section of North field used as a control because soybean from control sites established in North field in 2018 were severely damaged by Cobra herbicide and leaves collected were not satisfactory for standard nutrient analysis. | ||||||||||||||||
Table 3. Plant tissue analyses summary for 2018 and 2019, Osweiler Farm – SARE Project
For 2019, plant tissue analyses reveal trends similar to 2018 results (Table 3). The glyphosate control (NRU) showed reduced tissue content of Ca and Mg. The insufficient levels of Boron (B) and Molybdenum (Mo) at nearly all sites is of concern as these are critical micronutrients required for a number of important metabolic functions in both plants and microorganisms. It appears both corn and soybean are able to extract sufficient B, however, most plant tissue was deficient in Mo. These results confirm the need to monitor soil micronutrients and make appropriate amendment either to soils or as foliar applications when necessary.
Leaf chlorophyll analyses: Field measurements taken in 2018 on corn ear leaves (stage VT) showed an indirect relationship of soil residual glyphosate content on SPAD measurement in non-GM corn sampled along the transect (Figure 3). Interestingly, GM corn sprayed with glyphosate (NRU) revealed higher SPAD, however, this may reflect selection for efficient photosynthetic ability of a transgenic hybrid in presence of glyphosate. The non-GM corn showing highest SPAD readings under presumably lowest glyphosate exposure suggests that glyphosate detrimentally affects photosynthesis in this hybrid. Field measurements taken on soybean trifoliate leaves at bloom stage (R2) similarly showed an indirect relationship of soil residual glyphosate content on SPAD measurement in soybean sampled along the transect (Figure 3). As observed for corn, soybean showing highest SPAD readings under presumably lowest soil glyphosate exposuresuggests that glyphosate detrimentally affected photosynthesis in this particular variety.


Figure 3. SPAD units of leaf area of the earleaf of corn (top) measured on plants along the sampling transect in the north field and those in GM corn receiving glyphosate (check) and in non-GM corn not exposed to glyphosate. Leaves were monitored at VT corn developmental stage (tasseling) during the 2018 growing season. Samples collected at 100-ft intervals along each transect, and position locations are numbered beginning with western (1 or 228 ppb) through eastern points (4 or 82 ppb). SPAD units of leaf area of the newest expanded trifoliate leaves of soybean measured on plants along the sampling transect in the south field (bottom). Leaves were monitored at R2 growth developmental stage (flowering) during the 2018 growing season. Samples collected at 100-ft intervals along each transect, and position locations are correlated with soil glyphosate content from western (380 ppb) through eastern points (4 or 435 ppb) (See Figure 1 for the south field transect sample locations).
A summary of SPAD readings over the two-year period show fairly consistent values for corn and soybean over the rotation phase (Table 4). A decrease for the glyphosate check (NRU) may indicate cumulative effects of glyphosate residues in soil, however more replicate samples are needed to make a firm conclusion. Soybean following corn in the North field in 2019 show an overall reduced SPAD relative to soybean in South field in 2018, suggesting reduced activity to possible glyphosate drift from the field adjacent to the North field, as shown for corn in 2018.

Table 4. SPAD results summarized for corn and soybean during 2018-2019.
Objective 2. Concurrently monitor soil health in crop management transition without glyphosate.
Active Carbon: Active C was analyzed using the weak extractant POX as it represents the most sensitive soil organic C fraction to management changes and is therefore a sensitive biological indicator of soil health. Active C also indicates the level of microbiological activity present in soil. Active C contents were higher for all soils in 2018 relative to 2019. Values were similar across all cropped soils (including NRU), fencerow, and the non-grass drainage sites (Table 5). This is likely related to the lower SOM values for all sites (see Table 2), suggesting overall lower microbial activity. Highest active C in both years was associated with the grassed waterway sites, related to vegetation and higher SOM, and suggesting that management incorporating either perennial vegetation or consistent presence of living plants throughout the year will improve biological soil health.

Table 5. Active carbon contents in soils at selected sites during 2018 and 2019.
Soil Microbiome: The soil microbiome (“microbial community”) was assessed using the phospholipid fatty acid (PLFA) biochemical marker to distinguish broad groups including mycorrhizae, saprophytic fungi, Gram-negative and Gram-positive bacteria, actinobacteria, and protists. We found very little differences among all soils in the abundance of microorganisms in each of these groups (data not reported). It is not known whether the somewhat homogenous distribution of similar abundance is related to effects of management such that the microbiome was resistant to changes and remained similar to non-managed fencerow and waterway sites or if abiotic climatic factors had an impact. It should be noted that 2018 and 2019 experienced above normal precipitation during the growing seasons (27 and 30 inches during April – September, respectively), which may have reduced impacts of management. Interestingly, total PLFA content, an indicator of total soil microbial biomass, varied among the sites, with the glyphosate check (NRU) among the lowest suggesting an effect of cumulative soil glyphosate residue (Table 6). With two exceptions, highest total PLFA were associated with fencerow and waterway soils. Residual glyphosate may affect microbial abundance and biomass in the cultivated soils. More importantly, the type of soil ecosystem provided by undisturbed, perennial vegetation enhanced microbial abundance, which is important to soil health for providing diverse biological function (nutrient cycling, plant growth regulators, pathogen suppression, etc.) and a source of nutrients in biomass are recycled for plant availability.

Table 6. Soil microbiome as total PLFA content (pmoles/g dry soil) at selected sites within two fields under corn-soybean rotation, 2018-2019.
Soil Glucosidase Activity: Soil glucosidase is a microbial enzyme that represents C cycling ability by the microbiome and therefore is an indicator of soil microbial activity and considered a biological soil health indicator. Soil glucosidase appeared to be more sensitive to soil glyphosate residues than other biological indicators in our study (Table 7). Although activity values were lower in 2019 likely due to dry soil conditions at sampling, the trend relative to glyphosate content was consistent across years. The lowest activity associated with the highest soil glyphosate content (treatment NRU) illustrates this trend. Figure 4 shows a moderate correlation (correlation coefficient, R = 0.46) of decreasing soil glucosidase activity with increasing effective glyphosate content in the soil surface in 2018; this correlation is even stronger (R= 0.61) in 2019, suggesting that persistent glyphosate residues in soils are biologically available and interfere with microbial activity. The high content of soil residual glyphosate in the control soil (NRU) likely contributed to lowest glucosidase activity detected in those soil samples, which was consistent for both years. It is also possible that additional herbicide treatment to control glyphosate-resistant weeds or different weather patterns in 2019 led to values for fencerow and waterway soils to remain stable resulting in a consistency at about the same levels for both years. This suggests that favorable conditions in these sites not only provide for higher microbial activity but maintains the same level of activity across seasons.
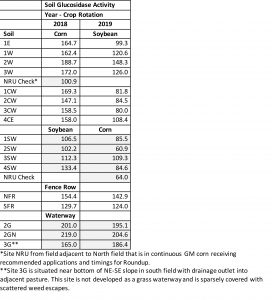
Table 7. Soil glucosidase activity, as amount of product produced per g of soil (ug PNP/g dry soil), at selected sites within two fields under corn- soybean rotation, 2018-2019.
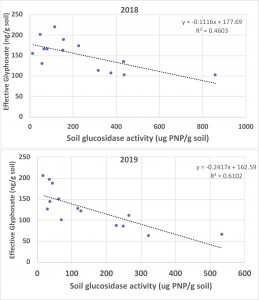
Figure 4. Relationship between soil effective glyphosate content with soil biological activity measured as soil glucosidase enzyme activity for both years of project at sampling sites where soils were analyzed for glyphosate/AMPA.